A Living Building Project Journey, Part-12
Net Positive Energy 2: Building Performance Analysis
In our February post titled "A Living Building Project Journey Part-6, Net Positive Energy", we outlined the process being used to design a project that produces at least 105% of the energy it consumes on an annual basis. We discussed the intentionality and rigor behind the decision-making process, the energy conservation measures under consideration, and some modeling results.
In late September, the design team presented the project at the 2017 ASHRAE Building Performance Analysis conference under the title, ‘Net-Positive Energy Performance in the Southeast through an Integrative Design Process’. The conference focused on the role of building performance analysis in design, operation, and policymaking. There was great emphasis on asking the right questions to most effectively inform analysis, choosing the right simulation tools and techniques for the job at hand, and graphically presenting the results to aid decision making. A session on lessons learned from ZNE (Zero Net Energy) projects focused not only on the best process to validate ZNE projects, but also on how ZNE success is 50% design intent and 50% monitoring-based operation.
This post builds on February’s Net Positive Energy post by sharing select design questions evaluated through building performance analysis since then as compiled for our technical presentation at the ASHRAE conference.
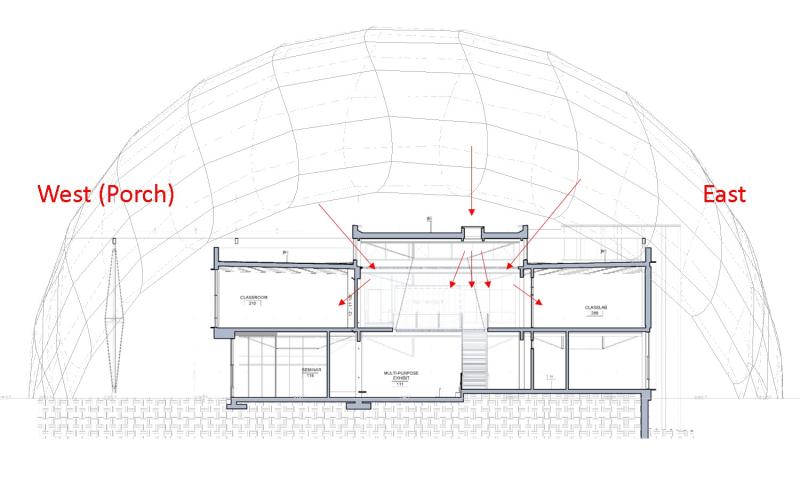
Q1. Given the depth of the porch, do the windows of the 2nd floor west-facing classrooms under the porch need exterior operable blinds that aid in solar load reduction?
Solar geometry analysis was conducted in Revit to assess the extent of afternoon direct solar gains on the 2nd floor glazing seasonally.
FIGURE 1. Shading analysis in Revit. (Image courtesy of Lord Aeck Sargent in collaboration with Miller Hull)
Based on the shading analysis, it was determined that the 2nd floor experiences direct solar gain only very late in the shoulder seasons, with full exposure not occurring until approximately 7:00pm and immediately before sunset in the winter.
Comfort analysis was also conducted to assess the efficacy of operable shades in the 2nd floor, west-facing classrooms. Specifically, the team used IES Virtual Environment to determine whether the space setpoint of 78 degrees was exceeded with or without shades.
FIGURE 2. Comfort analysis showing the number of hours exceeding 78F (space setpoint) in the space remain unchanged. (Image courtesy of PAE Engineers and Newcomb & Boyd)
This analysis led to the decision not to provide operable blinds on the exterior for the 2nd floor west-facing windows under the porch. The team made a similar decision for south-facing classroom and atrium windows without localized overhangs, again owing to the shading provided by the PV canopy overhang. This resulted in first cost savings for the project by eliminating unneeded shades that would have otherwise been included had their efficacy not been directly assessed.
Q2. Given the raised atrium roof configuration with clerestory windows, how much does the atrium’s daylight illumination benefit from retaining the three skylights currently planned?
Analysis was conducted using IES Virtual Environment to assess the adequacy of atrium daylight with and without the prismatic skylights.
FIGURE 3. Daylight simulation results of 'With Skylights' and 'Without Skylights' scenarios. (Image courtesy of Lord Aeck Sargent in collaboration with Miller Hull)
The results shown above are for a single point in time simulation for September 21 at noon under sunny sky conditions. The three 5’x10’ prismatic skylights, representing only 5 percent of the atrium roof area, significantly improved the quality and quantity of daylight in the atrium. Based on the analysis, it was determined that the estimated $6,950 first cost premium for the skylights represented good value, so they remained in the design.
Q3. What is the energy impact of providing coffee onsite?
The team evaluated the energy associated with providing varying types of on-site coffee service. The acronym EUI stands for the metric “Energy Use Intensity,” measured in kBtu/sf/year. EUI is analogous to the MPG rating of a car. Espresso coffee had the highest demand at 0.7 kBTU/sf/year, whereas cold brew coffee had the lowest impact at 0.25 kBTU/sf/year. Based on that analysis, the hot water coffee option, with an intermediate EUI impact, is planned to provide a desired amenity at a moderate energy demand.
FIGURE 4. EUI penalty of three different coffee options. Additional end uses included for context. (Image courtesy of PAE Engineers and Newcomb & Boyd)
You can read more on the topic of energy and coffee in a blog post by one of our project partners.
Q4. What is the EUI impact of operating some portions of the project continuously (24x7), compared to the more conventional building operation hours (70 hours per week) previously under consideration?
The team evaluated the impact of changing to continuous operations/occupancy for labs and offices using IES Virtual Environment.
FIGURE 5. Simulation results for the impact of continuous operations for portions of the project. (Image courtesy of PAE Engineers and Newcomb & Boyd)
Simulation results indicate an increase of 5 EUI units for 24x7 operation of some portions of the project. The increase can be attributed primarily to higher usage of lighting and HVAC as illustrated above.
Conclusion
At the conclusion of Design Development, the predicted EUI of the project is at approximately 35 kBtu/sf/year. Onsite photovoltaics (PV) will provide 105% of this energy budget, consistent with the Living Building Challenge’s Net Positive Energy requirement. An additional 15% safety factor has been included to account for unknowns and provide additional operational flexibility, with the PV system projected to produce approximately 425,000 kWh annually.
FIGURE 6. Currently projected energy consumption and renewables production. (Image courtesy of PAE Engineers and Newcomb & Boyd)
Funded through a private grant from The Kendeda Fund, Living Building at Georgia Tech is expected to become a Living Building Challenge 3.1 certified facility – the built environment's most rigorous and ambitious performance standard. The project’s design and build partners include architects Lord Aeck Sargent in collaboration with The Miller Hull Partnership, construction manager Skanska and design team consultants: Newcomb & Boyd, PAE Consulting Engineers, Uzun + Case, Biohabitats, Andropogon and Long Engineering.


No comments yet